This page was generated from /home/docs/checkouts/readthedocs.org/user_builds/xdesign/checkouts/stable/docs/source/demos/StandardPatterns.ipynb.
Interactive online version:
![]()
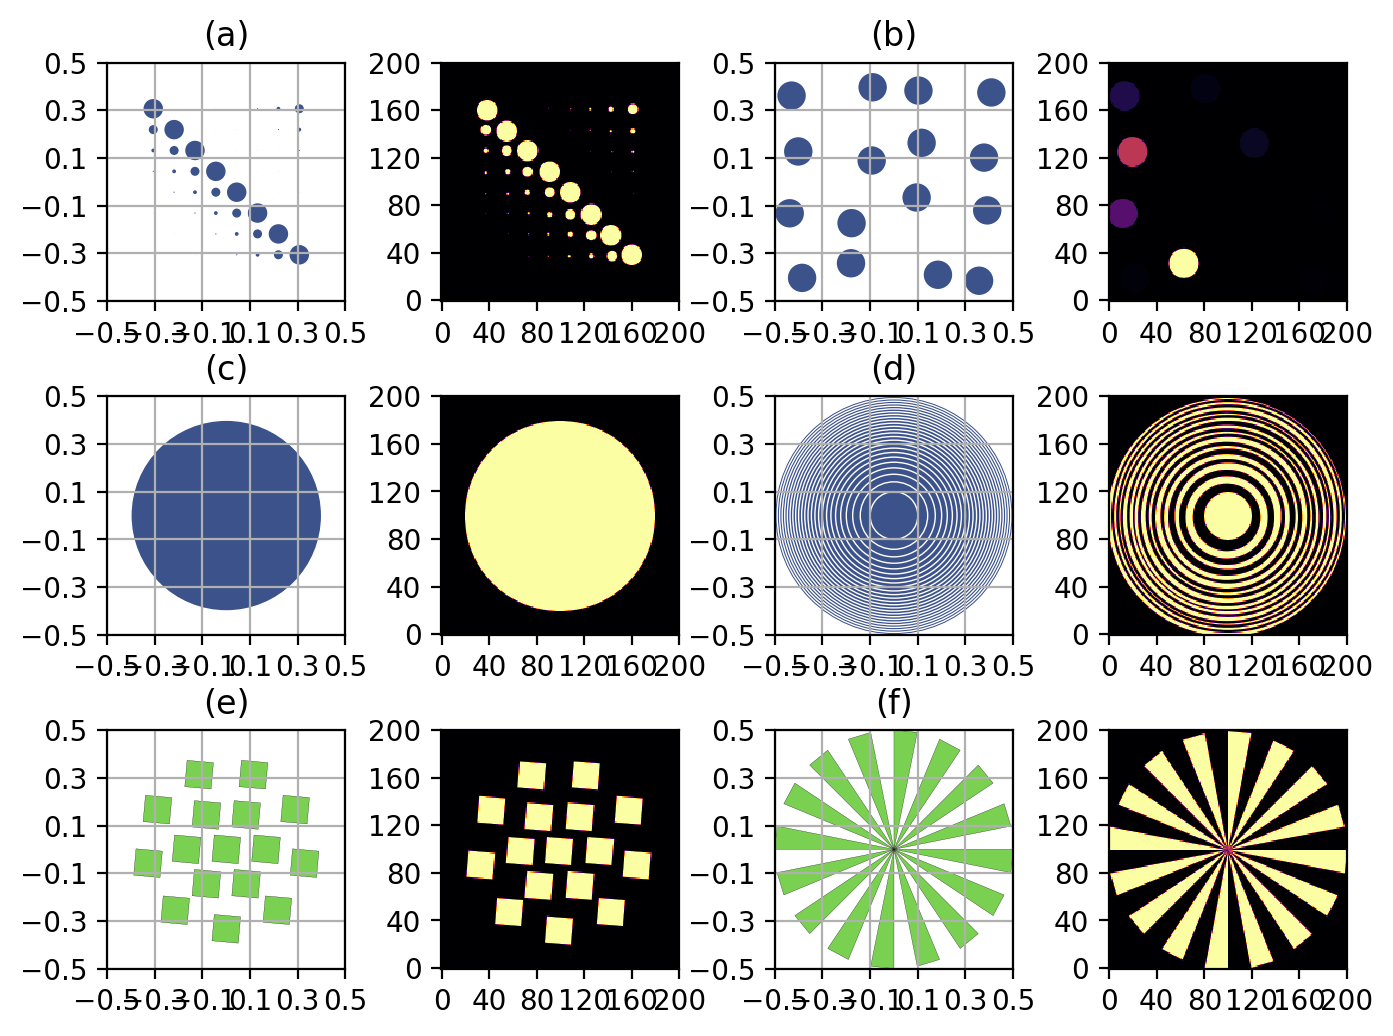
Standard Test Patterns
Generates sidebyside plots of all the standard test patterns in xdesign.
[1]:
from xdesign import *
import numpy as np
import matplotlib.pyplot as plt
import matplotlib.gridspec as gridspec
[2]:
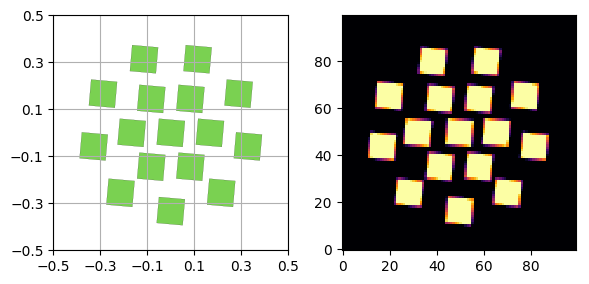
p = SlantedSquares(count=16, angle=5/360*2*np.pi, gap=0.01)
sidebyside(p)
plt.savefig('SlantedSquares_sidebyside.png', dpi='figure',
        orientation='landscape', papertype=None, format=None,
        transparent=True, bbox_inches='tight', pad_inches=0.0,
        frameon=False)
plt.show()
[3]:
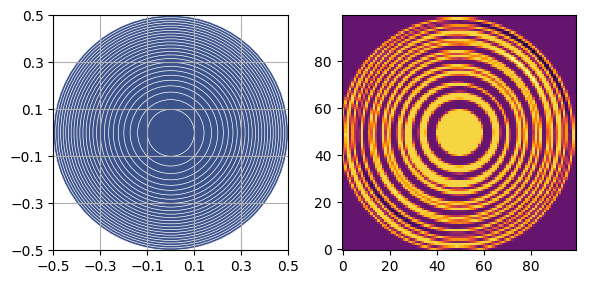
h = HyperbolicConcentric()
sidebyside(h)
plt.savefig('HyperbolicConcentric_sidebyside.png', dpi='figure',
        orientation='landscape', papertype=None, format=None,
        transparent=True, bbox_inches='tight', pad_inches=0.0,
        frameon=False)
plt.show()
[4]:
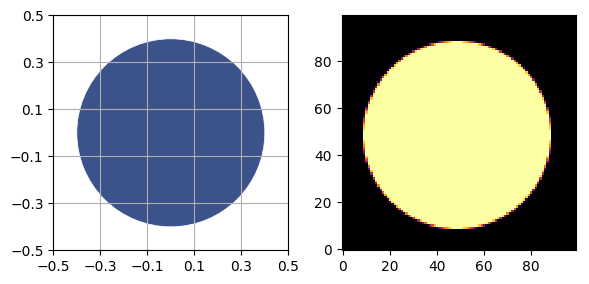
u = UnitCircle(radius=0.4)
sidebyside(u)
plt.savefig('UnitCircle_sidebyside.png', dpi='figure',
        orientation='landscape', papertype=None, format=None,
        transparent=True, bbox_inches='tight', pad_inches=0.0,
        frameon=False)
plt.show()
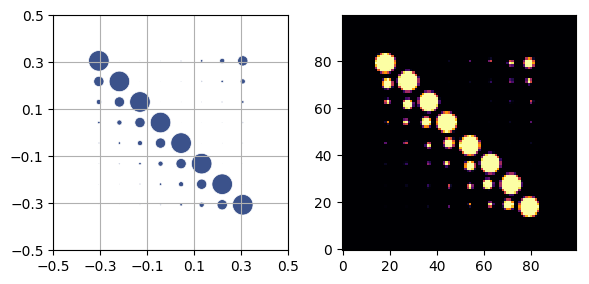
[5]:
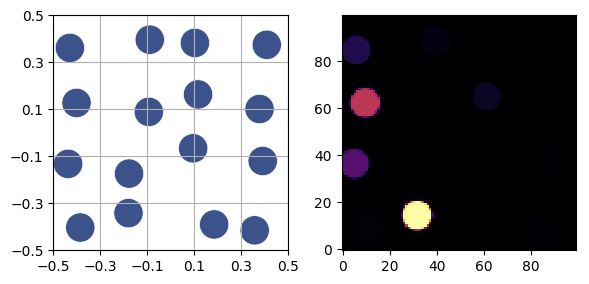
d = DynamicRange(steps=16, jitter=True)
sidebyside(d)
plt.savefig('DynamicRange_sidebyside.png', dpi='figure',
        orientation='landscape', papertype=None, format=None,
        transparent=True, bbox_inches='tight', pad_inches=0.0,
        frameon=False)
plt.show()
[6]:
l = DogaCircles(n_sizes=8, size_ratio=0.5, n_shuffles=0)
l.rotate(np.pi/2, Point([0.0, 0.0]))
sidebyside(l)
plt.savefig('DogaCircles_sidebyside.png', dpi='figure',
        orientation='landscape', papertype=None, format=None,
        transparent=True, bbox_inches='tight', pad_inches=0.0,
        frameon=False)
plt.show()
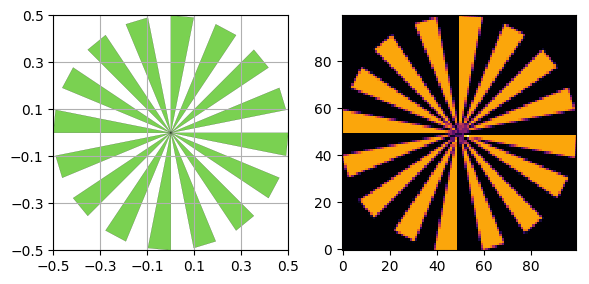
[7]:
s = SiemensStar(32)
sidebyside(s)
plt.savefig('SiemensStar_sidebyside.png', dpi='figure',
        orientation='landscape', papertype=None, format=None,
        transparent=True, bbox_inches='tight', pad_inches=0.0,
        frameon=False)
plt.show()
[8]:
fig = plt.figure(figsize=(8, 6), dpi=200)
gs1 = gridspec.GridSpec(3, 4)
gs1.update(wspace=0.4, hspace=0.4) # set the spacing between axes.
phantoms = [l, d, u, h, p, s]
letters = ['a','b','c','d','e','f','g']
for i in range(0, len(phantoms)):

    axis = plt.subplot(gs1[2*i], aspect=1)
    plot_phantom(phantoms[i], axis=axis)
    plt.grid()
#     axis.invert_yaxis()
    axis.set_xticks(np.linspace(-0.5, 0.5, 6, True))
    axis.set_yticks(np.linspace(-0.5, 0.5, 6, True))
    plt.xlim([-.5, .5])
    plt.ylim([-.5, .5])
    plt.title('('+ letters[i] +')')

    axis = plt.subplot(gs1[2*i+1], aspect=1)
    plt.imshow(discrete_phantom(phantoms[i], 200), cmap='inferno', origin='lower')
    axis.set_xticks(np.linspace(0, 200, 6, True))
    axis.set_yticks(np.linspace(0, 200, 6, True))

plt.savefig('standard_patterns.png', dpi='figure',
        orientation='landscape', papertype=None, format=None,
        transparent=True, bbox_inches='tight', pad_inches=0.0,
        frameon=False)
plt.show()
/home/user/python/venvs/py373/lib/python3.7/site-packages/matplotlib/cbook/__init__.py:424: MatplotlibDeprecationWarning:
Passing one of 'on', 'true', 'off', 'false' as a boolean is deprecated; use an actual boolean (True/False) instead.
  warn_deprecated("2.2", "Passing one of 'on', 'true', 'off', 'false' as a "
[ ]: