This page was generated from /home/docs/checkouts/readthedocs.org/user_builds/xdesign/checkouts/v0.6.0/docs/source/demos/Parameterized.ipynb.
Interactive online version:
![]()
Parameterized Phantom Generation
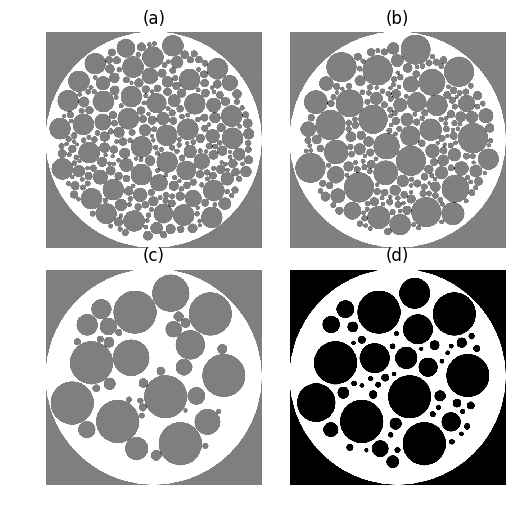
Demonstrates how a parameterized function can generate 4 different phantoms from the same parameterized class.
[1]:
from xdesign import *
import matplotlib.pyplot as plt
import numpy as np
import matplotlib.gridspec as gridspec

SIZE = 600
[2]:
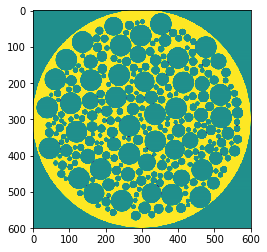
np.random.seed(0) # random seed for repeatability
p1 = Foam(size_range=[0.05, 0.01], gap=0, porosity=1)
d1 = discrete_phantom(p1, SIZE)
plt.imshow(d1, cmap='viridis')
plt.show()
/home/user/python/venvs/py373/lib/python3.7/site-packages/xdesign/phantom.py:368: RuntimeWarning: Reached termination criteria of 500 attempts before adding all of the circles.
  kTERM_CRIT), RuntimeWarning)
[3]:
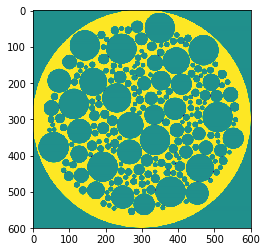
np.random.seed(0) # random seed for repeatability
p2 = Foam(size_range=[0.07, 0.01], gap=0, porosity=0.75)
d2 = discrete_phantom(p2, SIZE)
plt.imshow(d2, cmap='viridis')
plt.show()
[4]:
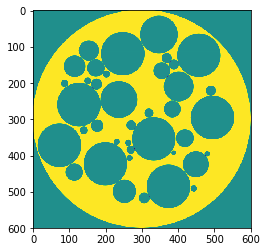
np.random.seed(0) # random seed for repeatability
p3 = Foam(size_range=[0.1, 0.01], gap=0, porosity=0.5)
d3 = discrete_phantom(p3, SIZE)
plt.imshow(d3, cmap='viridis')
plt.show()
[5]:
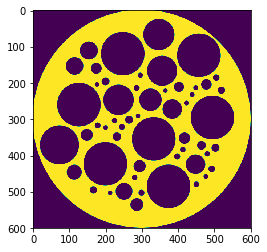
np.random.seed(0) # random seed for repeatability
p4 = Foam(size_range=[0.1, 0.01], gap=0.015, porosity=0.5)
d4 = discrete_phantom(p4, SIZE)
plt.imshow(d4, cmap='viridis')
plt.show()
Create a composite figure of all four discrete phantoms.
[6]:
fig = plt.figure(dpi=100)
gs1 = gridspec.GridSpec(2, 2)
gs1.update(wspace=0.1, hspace=0.1) # set the spacing between axes.

plt.subplot(gs1[0])
plt.title('(a)')
plt.axis('off')
plt.imshow(d1, interpolation='none', cmap=plt.cm.gray)
plt.subplot(gs1[1])
plt.title('(b)')
plt.axis('off')
plt.imshow(d2, interpolation='none', cmap=plt.cm.gray)
plt.subplot(gs1[2])
plt.title('(c)')
plt.axis('off')
plt.imshow(d3, interpolation='none', cmap=plt.cm.gray)
plt.subplot(gs1[3])
plt.title('(d)')
plt.axis('off')
plt.imshow(d4, interpolation='none', cmap=plt.cm.gray)
fig.set_size_inches(6, 6)
plt.savefig('Foam_parameterized.png', dpi='figure',
        orientation='landscape', papertype=None, format=None,
        transparent=True, bbox_inches='tight', pad_inches=0.0,
        frameon=False)
plt.show()
[ ]: